


2024 Geospatial Stocks Performance
What is the REAL Geospatial Top 100?

INTRODUCTION
As detailed in the first post:

…the point of this newsletter, podcast and networking effort is to maintain The Geospatial Index. The rules for building the index are detailed at that link. Something needs emphasising though. This portfolio never sells. It buys an $AUD100 position in every stock, then lets it sit till the company dies. Or if the company stops being geospatial or divests the geospatial part that meant the company went into the index. So this means some positions will come to dominate the index. The prime example is Oracle, which has been in since its 1986 IPO because Oracle Spatial was released 1984. You will see the consequences of this lengthy compounding runway for this highly successful company below.
It’s how time contributes when you let it run. This continues the time theme established in the last business profile of 2024, SeerAI:

Time is a vital edge in the market. This index uses it to the full. The benefits were on full display this year.
PERFORMANCE: OVERALL
All 363 stocks in The Geospatial Index vastly outperformed the benchmark, Autodesk, this year. They also outperformed the market, since the S&P 500 ‘only’ gained 25%. Another way to cast it is that, wherever one looks, it has been a bumper year.
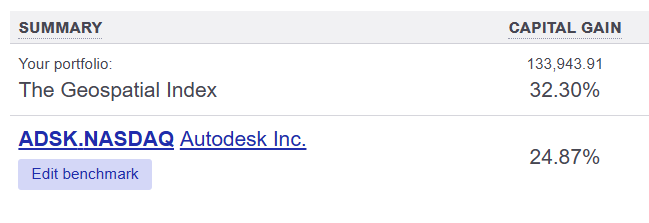
What about pure-play geospatial stocks? They had a capital gain of ‘only’ 22%. Hence it was better to buy the benchmark or the market rather than pure-play geospatial stocks in the past year. And what about the adjacent geospatial stocks alone? Those had the best year of all, 35%.
We are at the unsettling conclusion that this effort reveals it is not a good investment to buy pure-play geospatial stocks. It is better to buy the market or the benchmark - Autodesk. Best of all though is to avoid pure-play geospatial stocks altogether and ONLY buy geospatial adjacent companies. Specifically, these are ones that have, amongst many other non-geospatial products and services they sell, a geospatial one as well. So, Nvidia (through NVIDIA DRIVE Map, cuSpatial etc), Oracle (through Oracle Spatial and Graph), Google (through Google Maps) etc. By the way, through cuSpatial I came across Rapids.ai - “GPU Accelerated Data Science”. Looks pretty sick.
PERFORMANCE: SUBINDICES
For the whole index (not just pure-play), the top performing subindex for the year was Autonomous Systems with a gain of 135% due to, you guessed it, the 187% gain of Nvidia. The league table arranged by performance is below.
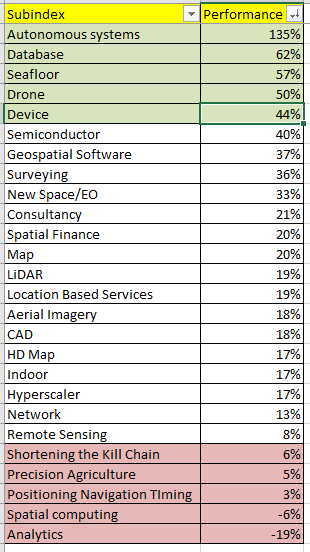
As detailed in the episode with Nadine Alameh, ‘Shortening the Kill Chain’ is the subindex others refer to as Defense Stocks:

Sorry, that’s all I have time for. If you want the pure-play breakdown let me know!
PERFORMANCE: STOCKS
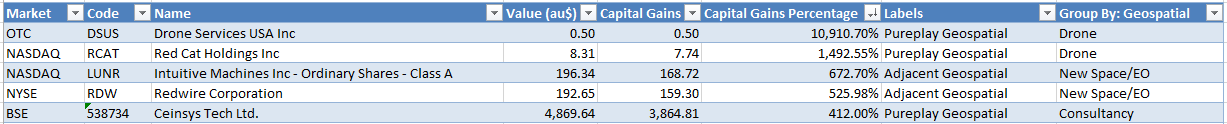
You’re all wondering which stocks were the best and worst. These are the top five:
And the bottom five:
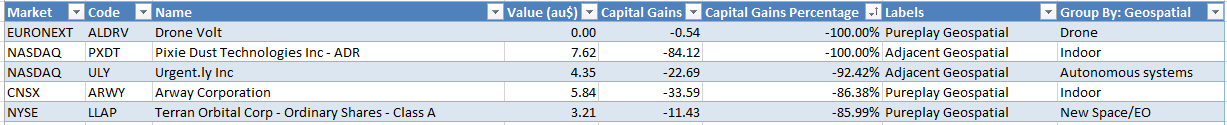
What can we tell? The only position of any significance amongst these is Ceinsys, an Indian firm. You can tell by their value, nearly $AUD5,000. The rest are tiny positions, far below their original $AUD100 starting point except Intuitive Machines and Redwire. And what do we know about those two? They’re in the tortured Earth Observation/New Space subindex. For an expert review of this subindex, Case Closed is well worth a follow:

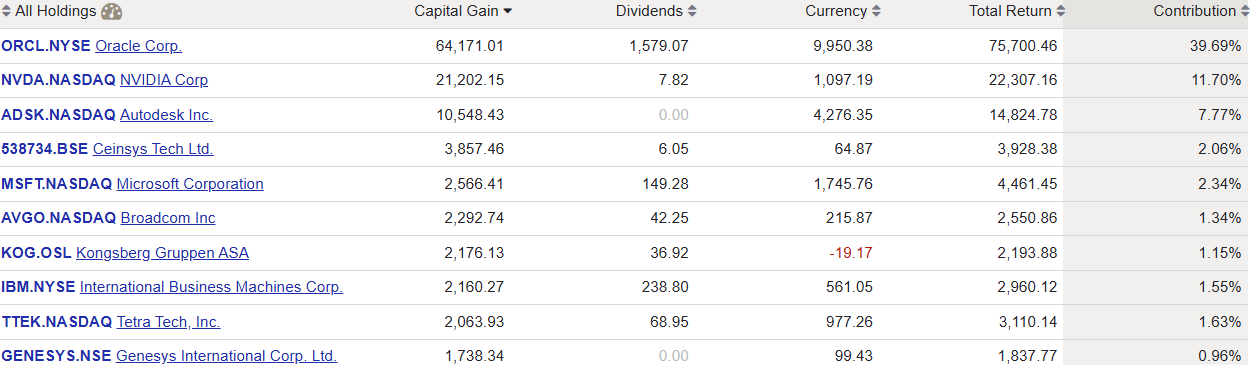
CONTRIBUTION: STOCKS
Let’s turn now to a contribution analysis. The first screenshot showed that the index gained $AUD134,000 in value this year. Which sub-indices and stocks explained most of that gain? Below are the top 10 stocks. Oracle and Nvidia were the only ones contributing more than 10%. Oracle contributed nearly 40%. We are left to conclude that one could probably get by with just owning Oracle for a significant amount of the flavour produced by The Geospatial Index overall.
CONTRIBUTION: SUBINDICES
Looking at subindices contributing the most and least, here they are in descending order:
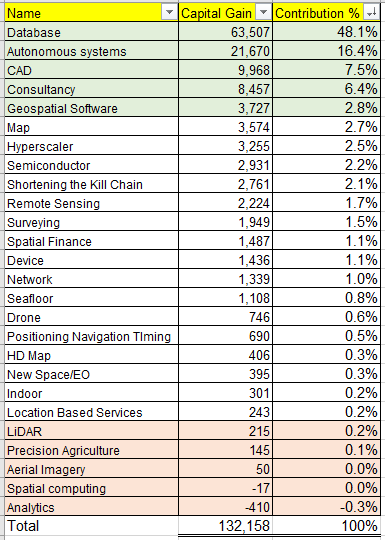
Fully 80% of the overall gain for the year is accounted for in the top 5. Analytics lost money this year, hence the negative contribution. Returning to the performance by subindex discussed above, we can see that both top and bottom 5 sets are different:
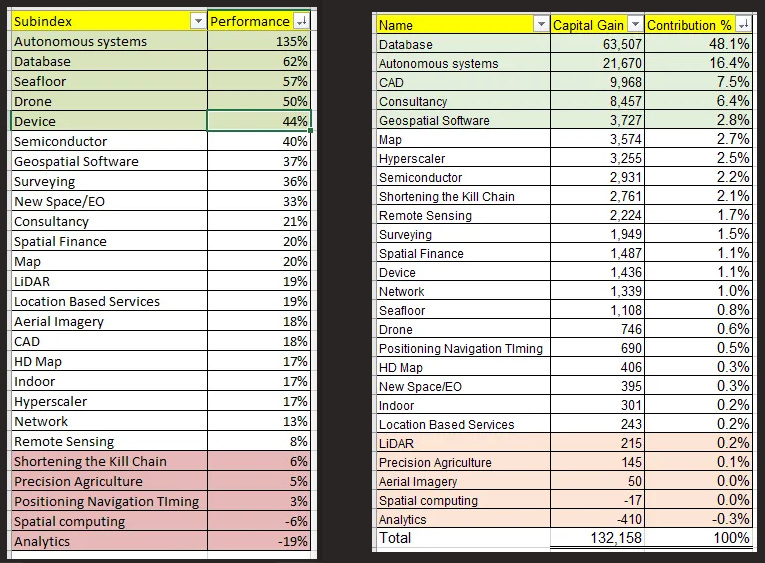
We can conclude from this that database and autonomous systems subindices performed and contributed highly. CAD, Consultancy and Geospatial Software on the other hand did not perform particularly highly but nevertheless contributed strongly. This is likely due to their containing very many stocks - Consultancy is over 40 for example, more than 10% of the total index count of stocks. Regarding performance, we can see that Seafloor, Drone and Device subindices performed well this year but did not make it into the top five in terms of contribution. This is due to both size and historical performance. Seafloor has less than 10 stocks in it and they’re all small companies. Drone and Device subindices have performed poorly in the past, so the value overall of these subindices is low. Hence it is tough for them to contribute a lot to overall gains despite performing well.
CONTRIBUTION: COUNTRIES
It is a sobering experience looking at the contribution across the 30 countries the index falls across:
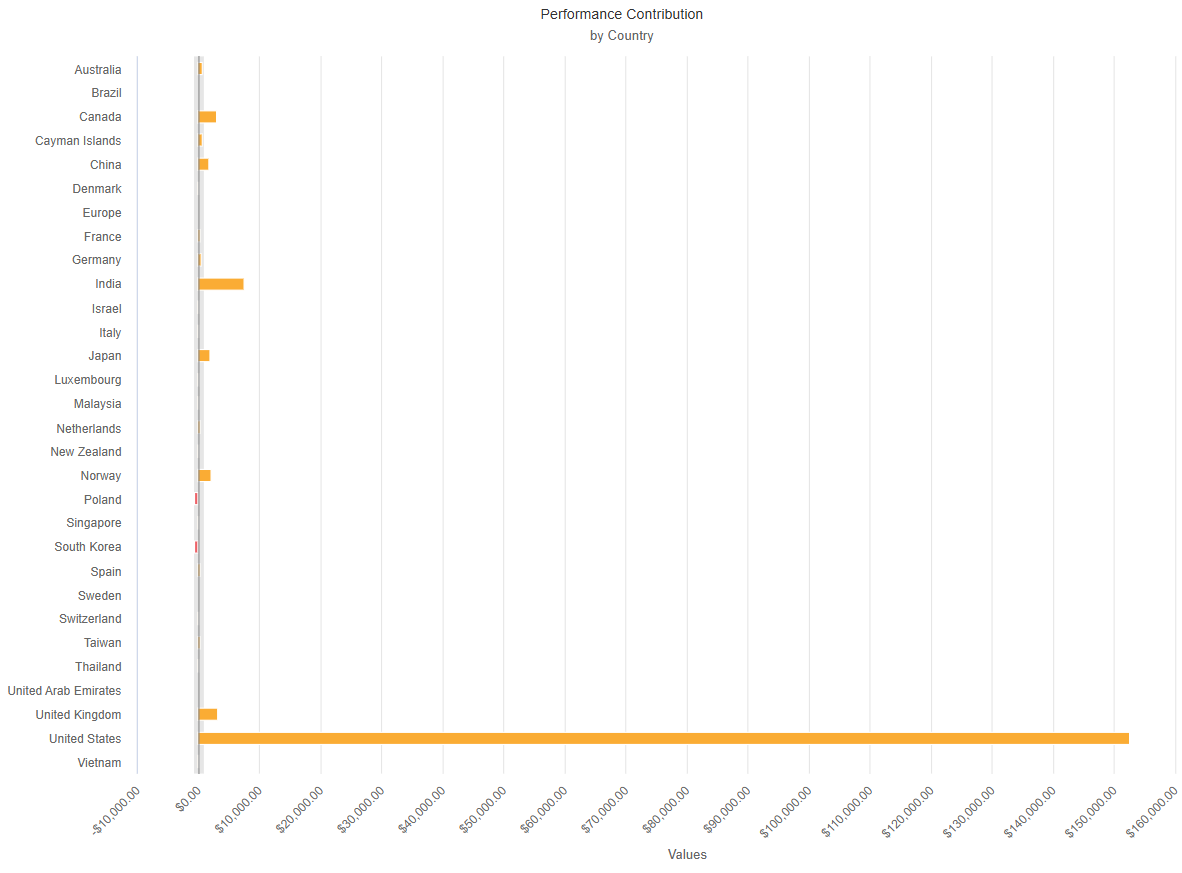
The only one that matters is the US, contributing 86% of the overall index gain for the year. The rest of the world, 29 other countries, are left with only 14% of the gains to fight over. Interestingly, India stands out here, whose stock market has been on an absolute tear since COVID. There are 19 companies in the index from India, yet they together contribute fully 4% of the overall index gain for the year.
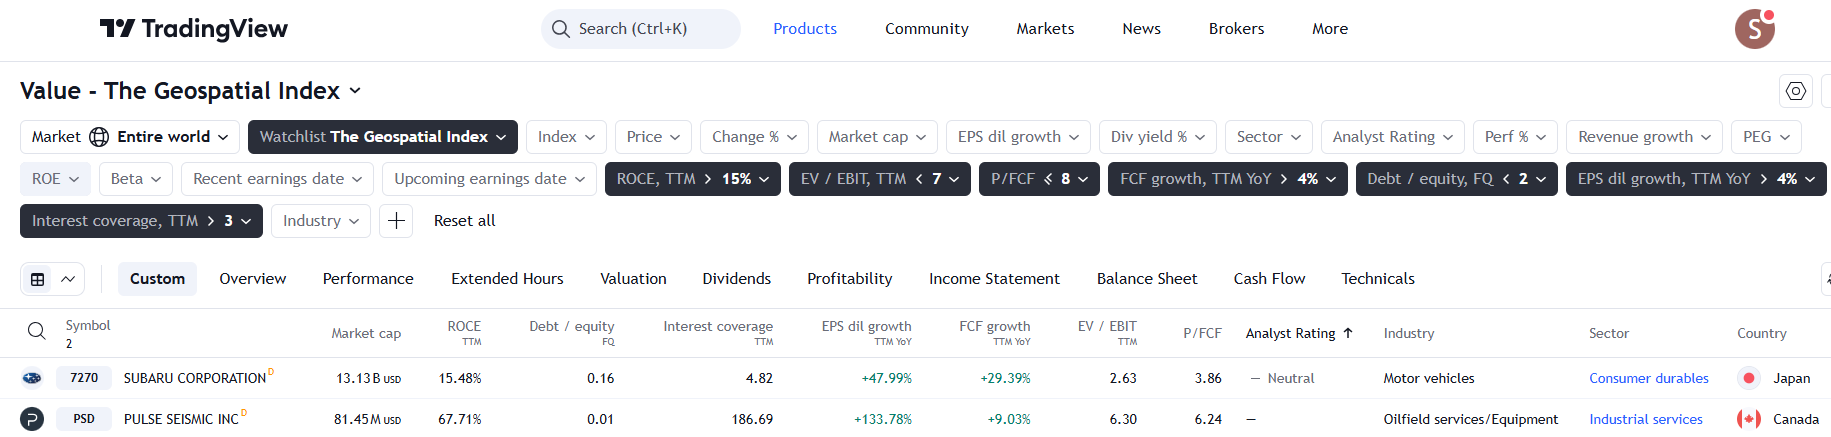
SCREENING
I discovered an incredibly useful aspect of the TradingView screening tool this year. One can feed a watchlist into it. So here is a value investor’s screen set to return only the interesting stocks from the index - Pulse Seismic and Subaru make the cut. The former is probably more interesting. Japanese automakers are known to stay at low multiples forever.
RETURN ON CAPITAL EMPLOYED
In the end, long term decent return on capital employed is what sorts the wheat from the chaff. Hence, another way to use the screener is to put trailing twelve months ROCE in as a column and return that metric against every component of the index:
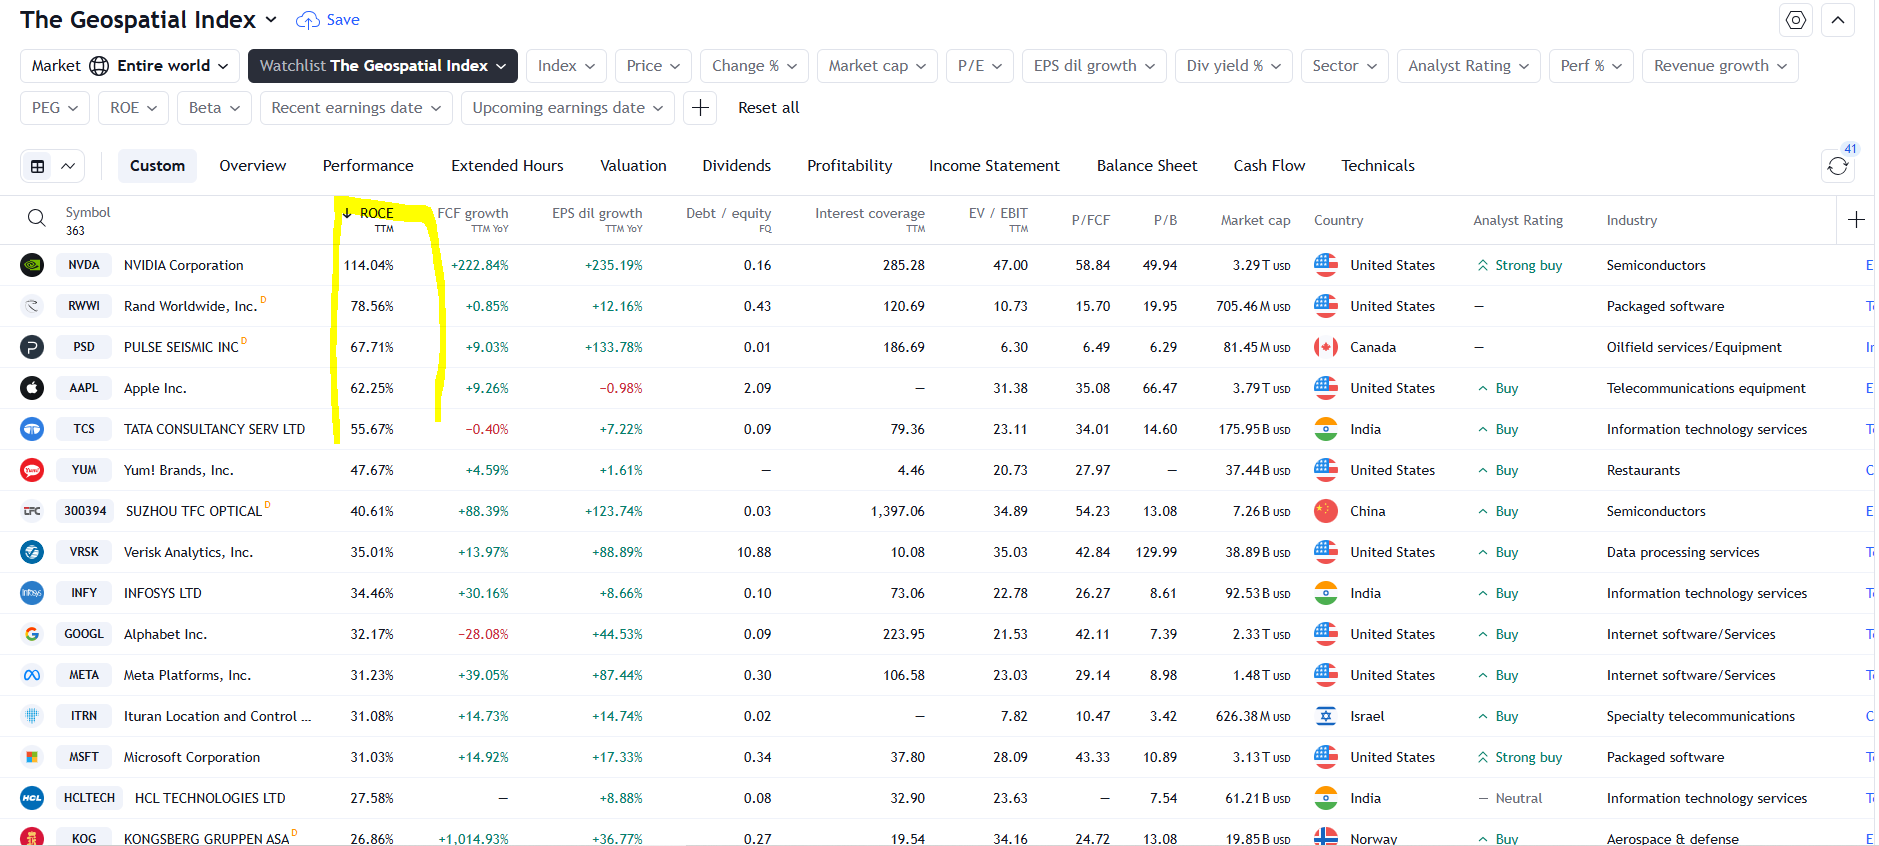
Ranking it that way showed there are only 71 companies in the past year that have achieved 15% ROCE. Why do I care? I’ve been taught by my value investing professor, Kenneth Jeffrey Marshall, to use this as a threshold before considering a company further. This is because the US market gets on average 10% ROCE. So if you’re going to buy individual stocks then they better outperform the market significantly for it to be worth the analytical effort and risk of portfolio concentration on single stocks.
TOP 100
As some of you might be aware, I was on the Geoawesomeness panel to select the Top 100 Geospatial Companies in 2022 and 2023. This year I was not invited back. How rude. So, to spite them, I have decided to make my own list. I will use a single metric, that discussed above of return on capital employed. I can already say that we do not even have 100 companies that make the cut. We only have 71 I’ve made those into a little watchlist for you to browse. It is ordered by ROCE descending. Here are the top 10:
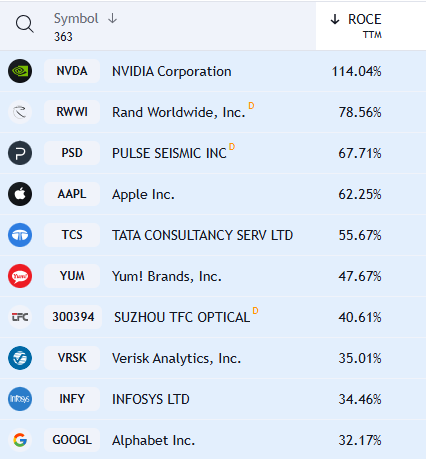
Now wasn’t that efficient? No need for a panel. No need for a lengthy evaluation period filled with subjectivity. Just let the companies perform and rank them end of year. Done.
Oh, you’re wondering about pure-play geospatial stocks? There were only 13 that made the 15% ROCE threshold this year, here they are:
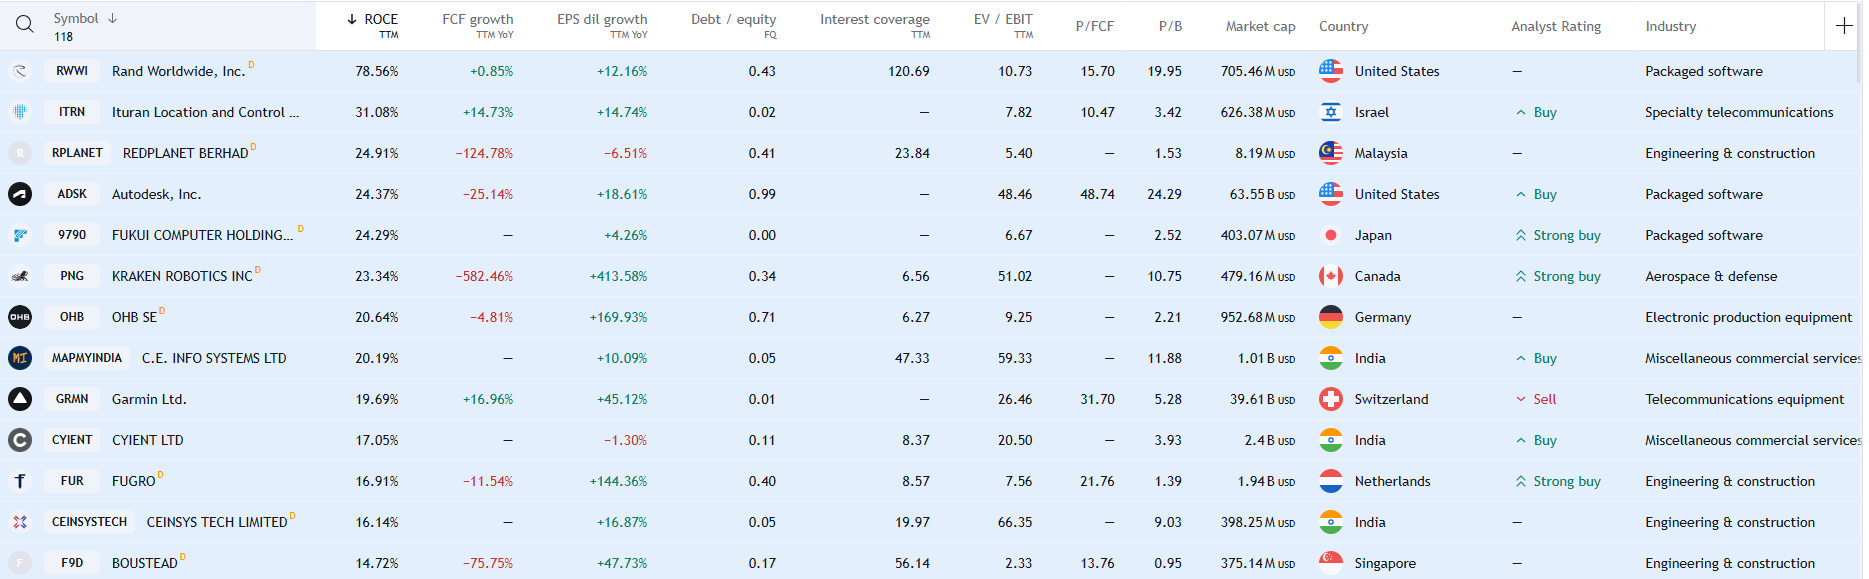
You can see that Fugro is there. I note it has high ROCE yet low multiples of EV/EBIT, FCF/MCAP and P/B. I continue to support the idea of evaluating it from the perspective of a value investment. A podcast guest this year, Eldar Rubinov, had some detail on the company from when he worked there:

CONCLUSION
In conclusion, you can stop reading the Geoawesomeness blog. Mine is better. So is this annual market intelligence report compared to their Top 100. Sorry Muthu and Aleks ;-)
In all seriousness, we can summarise things by defining the hunting ground. American stocks contribute the vast majority of gains. Due to a combination of time in the market and growth, the subindices of Database and Autonomous Systems are another way to see what to focus on through accounting for nearly 60% of gains this year. If you want to sharpen the focus to the ultimate degree, individual stocks Oracle and Nvidia, from the same two subindices respectively, accounted for 50% of overall gains. 2 stocks. Amongst 362 stocks.
I am reminded of the Pareto Principal.
We began with time and that’s where we’ll end. I am investing one lifetime at a time. Building on that, I’m running a multigenerational compounding engine. My goal is the use company ownership via the stock market to put the generations of my family that come after me in a position of power such that they do not have to spend 30 years in mortgage servitude to buy a house every generation. The family’s multigenerational portfolio will take care of their accommodation. Through the power of long term compounding, there will come a generation where they can live in a new house every day of the week.
Why do I know this? Look at Oracle, the dominant stock of this portfolio. With dividends reinvested and adjusting for stock splits, it has compounded at 21% since its IPO on 12 March 1986. You can check other stocks here. This has resulted in the initial $100 compounding to $AUD185,000 now if you had bought at the IPO back then:
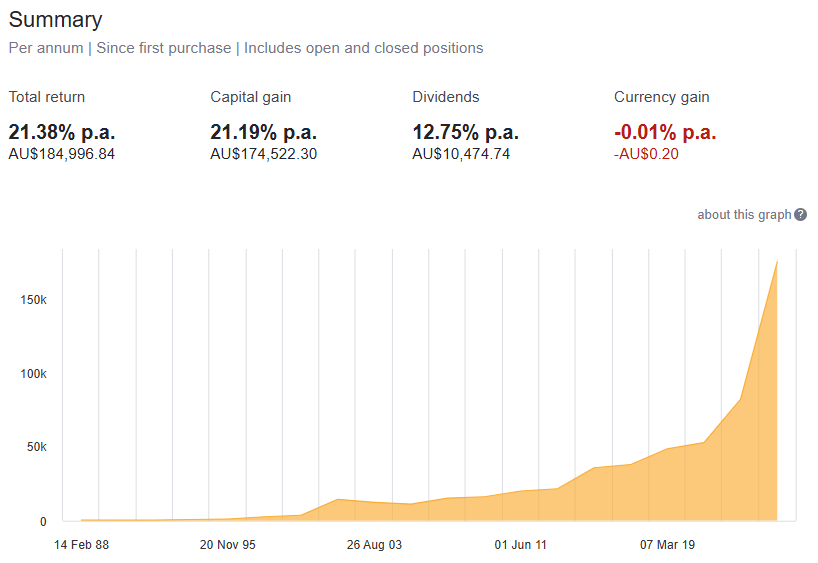
It might look like this index is about space. But really it’s about time.
Happy 2025.
Peace.
Wil