


Andrew Schroeder is Vice President of Research and Analysis at Direct Relief. He talks about the #LAfire situation and Direct Relief's response. He goes on to cover the use of human mobility data for analysis, geospatial AI models for damage detection and health system impact analysis. It was a privilege to encounter an analyst of the world as it turns.
This is a continuation of the last post:
Good Maps of the LA Fires

A week ago I did an episode with Priscilla Cole about her organizing the Geospatial Risk Summit:The Geospatial Index is a reader-supported publication. To receive new posts and support my work, consider becoming a free or paid subscriber.
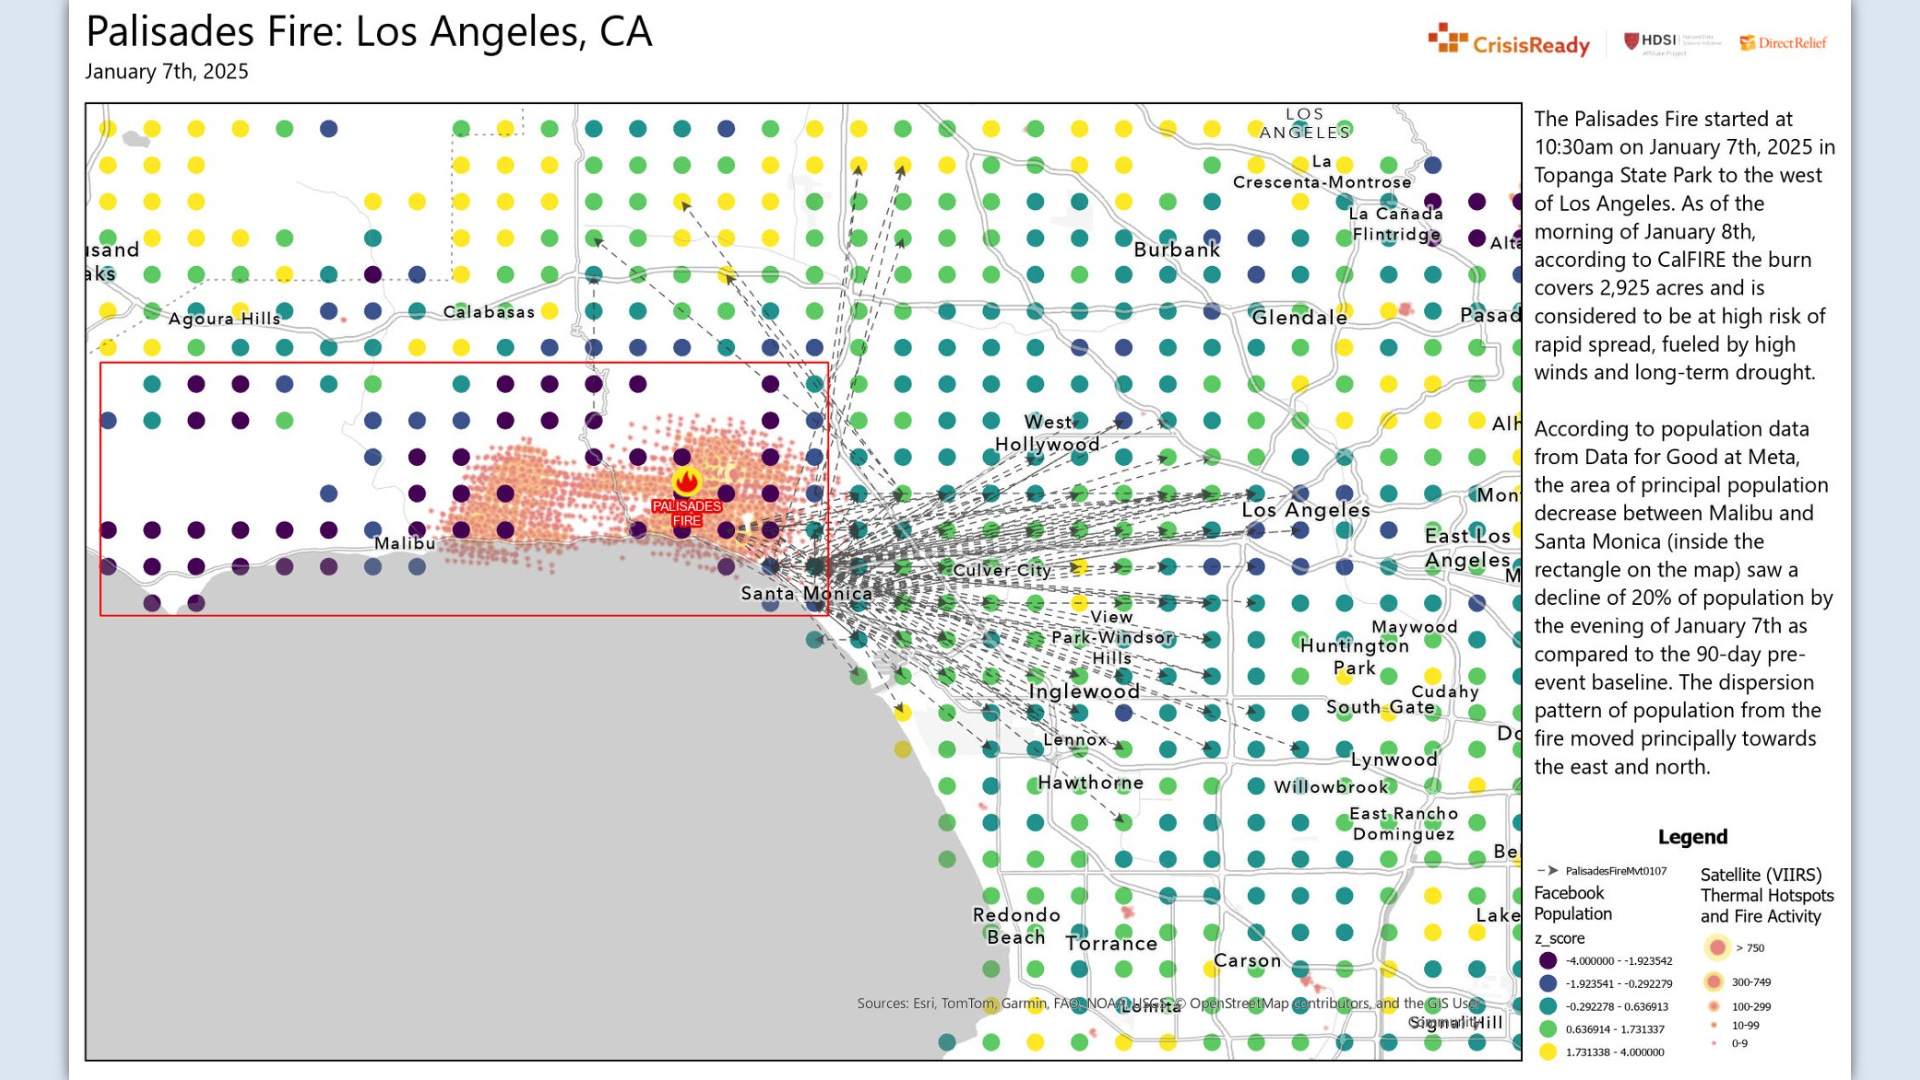
…where several maps of his were profiled, showing movement of people from fire affected areas to refuges. It was a really great angle on the crisis and unique amongst all the static maps and dashboards using static data from others.
You can try out the app here. Pressing the play button top of screen after hitting the movement tab in the controls area on the left gives you this animation:
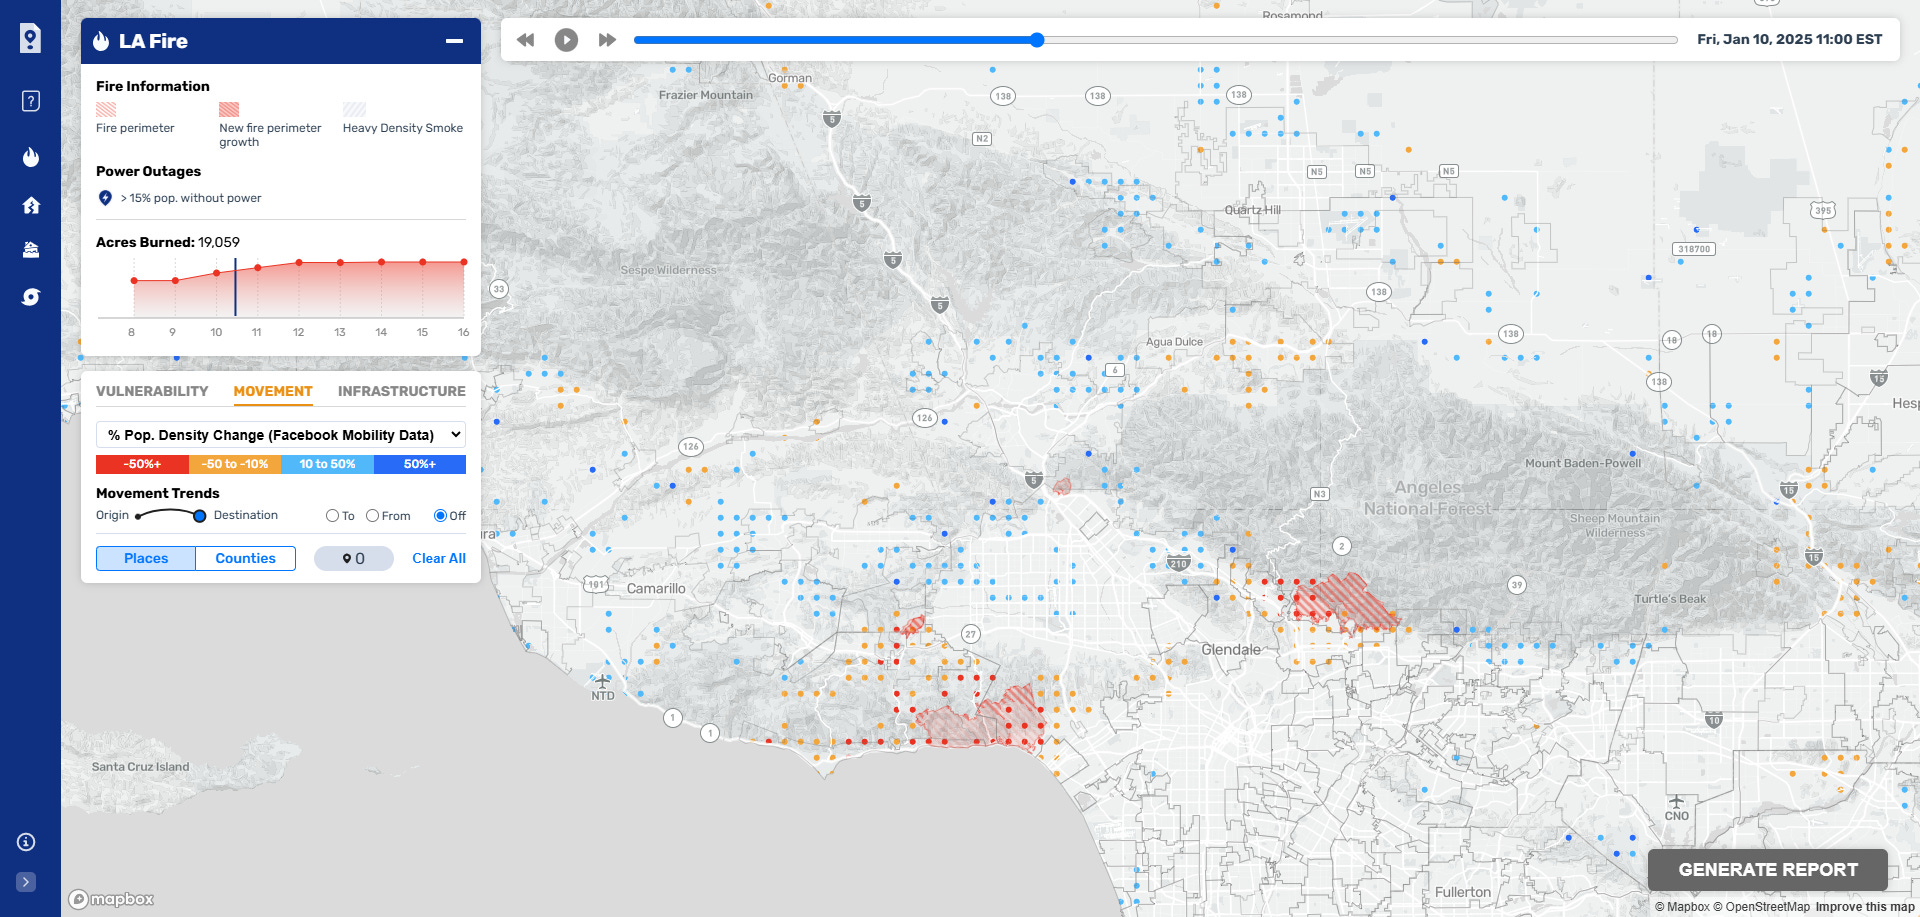
As discussed in the episode, there is incredible power granted those with access to this human movement data. It is good that those planning logistical responses to disasters can access it. This means they have a better chance to meet demand for resources at the right location during a crisis. In the case of Direct Relief, focused on medical supplies, the need to get this right could mean saving lives.

A few topics mentioned during the episode were
SKAI - “Developed by the World Food Programme (WFP) in collaboration with Google Research… From rapid building damage assessment to situational awareness and resource allocation, SKAI is redefining the way we respond to crises.”
“The International Charter Space and Major Disasters strives to be a key provider of Earth-observation satellite data and works with experts to derive information products to support disaster relief organizations in saving lives, property, infrastructure, and the environment following major disasters worldwide.”
Jamon Van Den Hoek is Associate Professor at Oregon State University. He produced building damage assessments using synthetic aperture radar data featured in publications like The Financial Times:
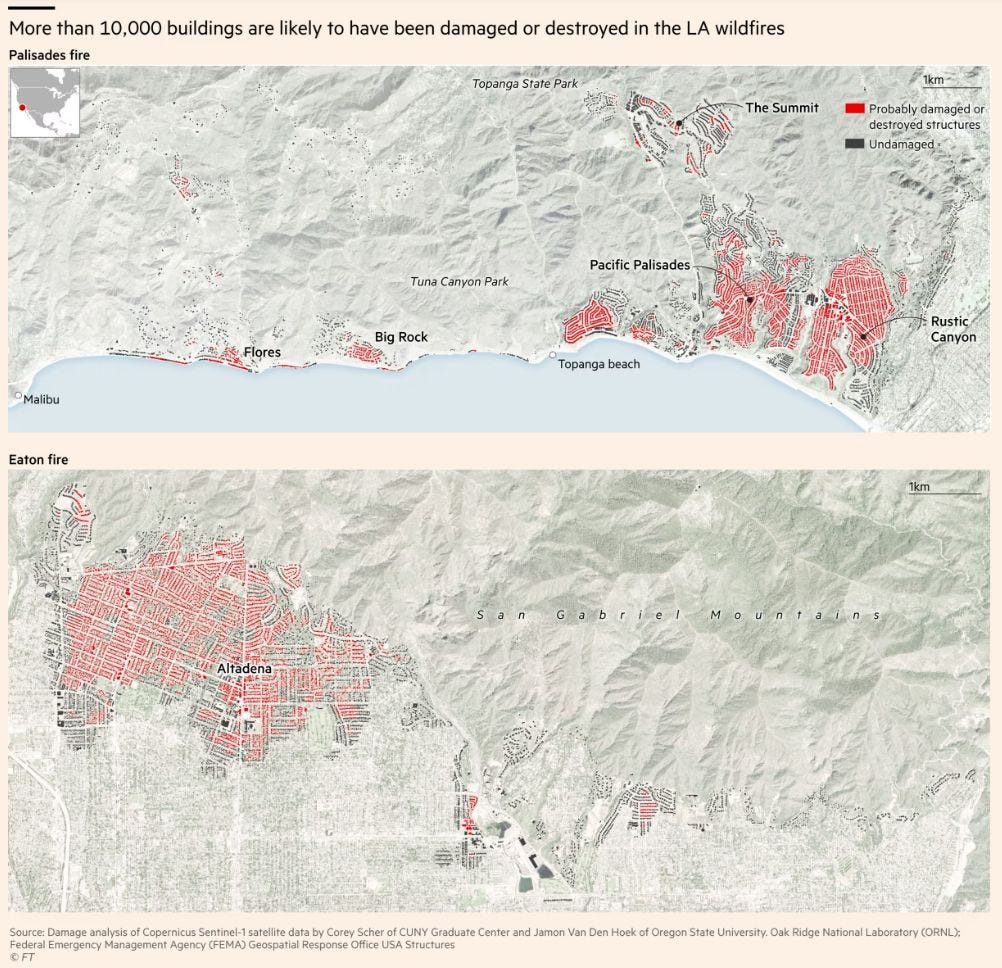
Something else I noted from the sources shown bottom of the FT image is that they use Map Creator. Always interesting to come across new web mapping tools, especially ones trusted by orgs like FT.
Purple Air is the air quality service Andrew mentioned.
Finally, a Black Rock podcast about their geospatial team was mentioned along with the phrase ‘analysis as the world turns’. Here is that episode:

Andrew, you have shown us how it’s done. Thank you for your service.
THE GEOSPATIAL INDEX
The Geospatial Index is a comprehensive listing of all publicly traded geospatial businesses worldwide. Why? The industry is growing at ~5.4% annually (after inflation and after adjusting for base rates). This rate varies significantly, however, by sub index. For ~$400,000 to start, this growth rate is $5,000,000 over a working life. This channel, Bluesky account, newsletter, watchlist and podcast express the view that you are serious about geospatial if you take the view of an investor, venture capitalist or entrepreneur. You are expected to do your own research. This is not a replacement for that. This is not investment advice. Consider it entertainment.
NOT THE OPINION OF MY EMPLOYER
NOT YOUR FIDUCIARY
NOT INVESTMENT ADVICE
Bluesky: https://bsky.app/profile/geospatial.money
LinkedIn: https://uk.linkedin.com/in/geospatialindex
Watchlist: https://www.tradingview.com/watchlists/123254792/
Newsletter:
Spotify:

Share this post